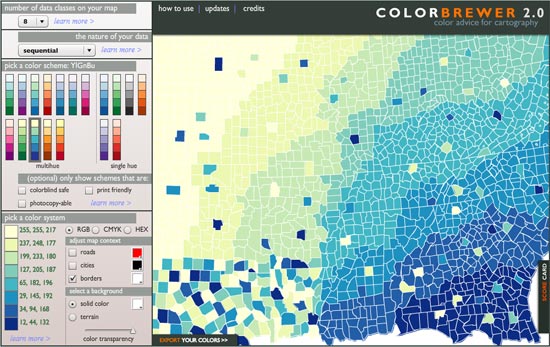
Colorbrewer 2.0
/ © Cynthia Brewer, Mark Harrower and The Pennsylvania State University. www.axismaps.com
When building maps and information graphics, choosing the right colors to help designate variables--whether population, temperature, or campaign dollars--is a time-consuming challenge.
How does one choose colors that are effective in communicating data, that can be read by the colorblind, that can be considered print fiendly and/or "photocopy-able" ?
The folks at Penn State have built Colorbrewer 2.0, an effective tool to swiftly aid in the process.
Once a palette is chosen, this free on-line tool allows for easy export to ArcGIS (a mapping app), Excel, or any Adobe product. You can also simply copy and paste the RGB, CMYK or HEX values.