Fast Company: Is Information Visualization the Next Frontier for Design?
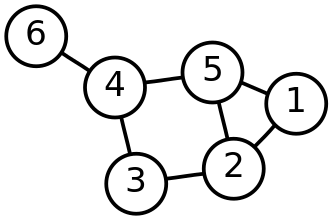
The Tokyo firm Information Architects created this Web Trend Map which presents the most popular Internet sites in the intelligible graphic language of a subway system.

It is great to see that Fast Company is catching the visualization religion.

This post mentions the Obama speech Wordles, Tufte's screed against PowerPoint, and blogs that cover visual complexity (including the blog, Visual Complexity

Visualization may play a big role in wising up consumers. In the future, we're told, sensors will pick up tiny bits of info on every aspect of our lives and they will be played back to us as graphics. The smart grid, for example, will read the energy use in your home and send back understandable displays suggesting how you might save money by, say, waiting an hour to turn on your air conditioner or reducing your thermostat by two degrees. It will be up to architects to imbed this feature in the home in a way that allows us to interact more efficiently with our surroundings.

It's good to know, however, that Alphachimp Studio is on the frontier of design

Check out more Obama visualizations not mentioned by Fast Company (bastages) at The Center for Graphic Facilitation:

Brainpower May Lie in Complexity of Synapses

We always if we were smarter than chimps (or at least baboons).
Here is clinical proof as to why the human brain has a better handle on complexity.

This article profiles a whole new dimension of evolutionary complexity has now emerged from a cross-species study led by Dr. Seth Grant at the Sanger Institute in England.

clipped from www.nytimes.com

Evolution’s recipe for making a brain more complex has long seemed simple enough. Just increase the number of nerve cells, or neurons, and the interconnections between them. A human brain, for instance, is three times the volume of a chimpanzee’s.

The computing capabilities of the human brain may lie not so much in its neuronal network as in the complex calculations that its synapses perform, Dr. Grant said. Vertebrate synapses have about 1,000 different proteins, assembled into 13 molecular machines, one of which is built from 183 different proteins.

These synapses are not standard throughout the brain, Dr. Grant’s group has found; each region uses different combinations of the 1,000 proteins to fashion its own custom-made synapses.

Each synapse can presumably make sophisticated calculations based on messages reaching it from other neurons. The human brain has about 100 billion neurons, interconnected at 100 trillion synapses.


blog it

Quick Primer on Graphs and Networks

The power and flexibility of a network--whether a simple group of casual neighbors or a complex next generation communication network--depends not just on the number of connections, but on the quality of the nodes, and more important, the type of nodes. Below is a fantastic intro to the concept of graphs and networks. It helps in understanding the a social graph and how it differs from a social network.

In Mathematics, a Graph is an abstraction for modeling relationships between things. It is no different from a Network, which is a more common term for describing the same thing. Graphs consists of nodes and edges, or things and the ways that things relate to each other. As it turns out, Graphs are very powerful modeling tools for modeling natural and man-made systems. Diverse things like the Web, power grids, economies and even cells can be represented and analyzed as networks.


Note: Images above are from the Visual Complexity Gallery

What is also remarkable is that a lot can be said about a graph by looking at its structure; and the evolution of the structure. For example, epidemiologists use graph structures to predict the spread of an epidemic. The very same model can be used to understand how wild fire spreads, as well as how to engineer a viral marketing campaign. The better we understand the structure of a system's graph, the more we can control it, predict it and analyze it.


blog it